RSI (Relative Strength Index)
Quick Answer
A momentum indicator measuring the speed and magnitude of price changes on a 0-100 scale.
What is RSI?
The Relative Strength Index (RSI) is one of the most popular technical indicators used by traders worldwide. Created by J. Welles Wilder Jr. and introduced in his 1978 book 'New Concepts in Technical Trading Systems,' RSI measures the magnitude of recent price changes to determine if a security is overbought or oversold.
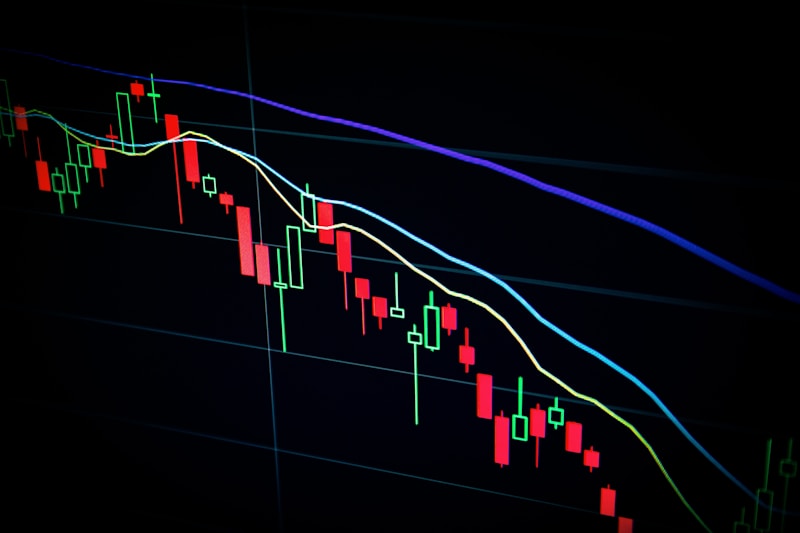
RSI is displayed as an oscillator (a line graph) that moves between 0 and 100. The indicator is typically used with a 14-period setting, meaning it analyzes the last 14 candles of price data.
How It Works
RSI calculates the ratio of upward price movements to downward price movements over a specified period. Here's the simplified process:
- Calculate average gains and losses over the lookback period (typically 14)
- Divide average gain by average loss to get Relative Strength (RS)
- Convert RS to RSI using the formula: RSI = 100 - (100 / (1 + RS))
The result is a value between 0 and 100. Higher values indicate stronger upward momentum, while lower values indicate stronger downward momentum.
Key Levels
Overbought (Above 70) When RSI rises above 70, the asset may be overbought, meaning it could be due for a pullback or reversal. However, in strong uptrends, RSI can remain overbought for extended periods.
Oversold (Below 30) When RSI falls below 30, the asset may be oversold, suggesting a potential bounce or reversal. In strong downtrends, RSI can stay oversold for a while.
Note
Common Mistakes
:::warning 1. Using RSI signals in isolation - RSI works best when combined with other indicators and analysis methods
- Ignoring the trend - RSI behaves differently in trending vs. ranging markets. In strong trends, overbought/oversold readings can persist
- Using default settings blindly - Consider adjusting the period based on your trading timeframe
4. Expecting immediate reversals - Overbought doesn't mean 'sell now' and oversold doesn't mean 'buy now' :::
Real-World Example
When Apple's RSI dropped to 25 during the March 2020 crash, it signaled an extreme oversold condition. Traders who recognized this had an opportunity to buy before the subsequent 100%+ rally.